
Asset returns and benchmarks - Teachers
How the plan's investments are doing
Learn how the investment portfolio of BC's Teachers' Pension Plan performed in recent years.
Asset returns and benchmarks
The board tracks investment returns by categories in the portfolio.
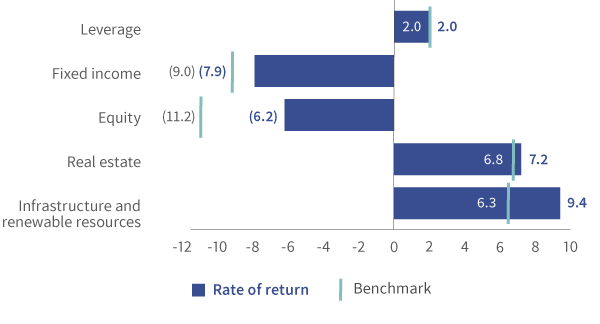
The chart below shows how the plan’s investments in certain categories compare to performance benchmarks in 2024. A benchmark is a standard used to measure the performance of an investment or a portfolio.
2024 Rate of return vs benchmark (%)
The tables below compare the plan’s overall investment returns to performance benchmarks over 1-year, 5-year and 10-year periods.
The board expects that some years will have lower returns. That’s why it looks not only at quarterly and annual returns but also at long-term performance.
| Annual rates | Investment returns (%) |
Performance benchmark (%) |
| 2024 | 10.6 | 13.9 |
| 2023 | 7.6 | 11.5 |
| 2022 | (3.4) | (5.9) |
| 2021 | 11.6 | 8.4 |
| 2020 | 10.7 | 11.2 |
|
|
||
| Five-year annualized rates |
||
| 2024 | 7.3 | 7.5 |
| 2023 | 7.8 | 7.4 |
|
|
||
| Ten-year annualized rates |
||
| 2024 | 7.9 | 7.6 |
| 2023 | 8.0 | 7.2 |